Blog sheet week 5
1.
Functional check: Oscilloscope manual page 5.
Perform the functional check (photo).
 |
| Figure 1. The functional check of Oscilloscope |
2.
Perform manual probe compensation (Oscilloscope
manual page 8) (Photo of overcompensation and proper compensation).
To adjust the probe for proper compensation we used the provided to turn the screw on the probe until it showed the proper signal as shown in figure 3.
To adjust the probe for proper compensation we used the provided to turn the screw on the probe until it showed the proper signal as shown in figure 3.
 |
| Figure 2. Overcompensation |
 |
| Figure 3. Proper compensation |
3.
What does probe attenuation (1x vs 10x) do
(Oscilloscope manual page 9)?
When the Attenuation switch is set to 1X, the P2200 probe limits the bandwidth of the oscilloscope 7MHz. When the switch is set to 10X you will have full bandwidth of the oscilloscope.
4. How do vertical and horizontal controls work?
Why would you need it (Oscilloscope manual pages 34-35)?
When the Attenuation switch is set to 1X, the P2200 probe limits the bandwidth of the oscilloscope 7MHz. When the switch is set to 10X you will have full bandwidth of the oscilloscope.
The vertical controls adjust the function up when the
knob is turned clockwise. When the vertical knob is turned counter clockwise
the function is moved down. The horizontal controls move the function from
right to left. When the horizontal knob is turned clockwise the function is
moved to the right, when it is turned to the left the function moves to the
left. We need these functions so we can display the function in the proper
location to allow us to get a clear view of the function.
5.
Generate a 1 kHz, 1 Vpp around a DC 2 V from the
function generator (use the output connector). DO NOT USE oscilloscope probes for the function generator. There is
a separate BNC cable for the function generator.
a.
Connect this to the oscilloscope and verify the
input signal using the horizontal and vertical readings (photo).
We generate a 1kHz, 0.6 Vpp, around DC 0.35V from the function generator, and it can be verified from the readings on the oscilloscope.
 |
| Figure 4. Generate a 1kHz, 0.6 Vpp around DC 0.35V from the function generator |
b.
Figure out how to measure the signal properties
using menu buttons on the scope.
As you can see in the picture below we were able to get all the measurements displayed on the right side of the screen. We were able to get this by pressing the measure button in the menu. This will display all the values. We are also able to change which measurements we see. We have Vrms, frequency, peak to peak voltage, and the period.
As you can see in the picture below we were able to get all the measurements displayed on the right side of the screen. We were able to get this by pressing the measure button in the menu. This will display all the values. We are also able to change which measurements we see. We have Vrms, frequency, peak to peak voltage, and the period.
 |
| Figure 5: Using menu buttons to measure the signal |
6.
Connect function generator and oscilloscope
probes switched (red to black, black to red). What happens? Why?
When the cables are connected like this the oscilloscope shows nothing. The black end of the oscilloscope is a hard ground. When we connect the hard ground to the red probe of the signal generator we send the signal straight to ground so we can not read anything on the scope.
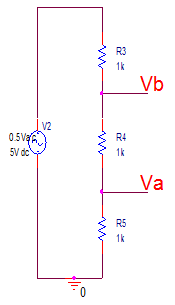
7.
After calibrating the second probe, implement the
voltage divider circuit below. Measure the following voltages using the
Oscilloscope and comment on your results:
a.
Va and Vb at the same time
(Photo)
From the measurement, we know that Va = 100mV, Vb = 240mV.
 |
| Figure 6. Readings of Va and Vb |
b.
Voltage across R4.
We noticed that we could not measure the voltage across R4 directly. So we measured the voltage of Vb and Va and found the difference between them, which is the voltage across R4.
Voltage across R4 = Vb - Va = 240mV - 100mV = 140mV
8.
For the same circuit above, measure Va
and Vb using the handheld DMM both in AC and DC mode. What are your
findings? Explain.
We found that you can't measure the voltage across one resistor directly with the oscilloscope because if you attach the ground of the oscilloscope to the circuit at Va you will short the circuit there and eliminate the resistance of R5. Since the all of the resistors have the same resistance they should all use the same amount of voltage. This is proven in our measurements since Vb is very close to twice the value of Va in AC and DC mode on the DMM.
In AC mode: Va = 0.094V, Vb = 0.194V.
In DC mode: Va = 20.5mV, Vb = 41.5mV.
We found that you can't measure the voltage across one resistor directly with the oscilloscope because if you attach the ground of the oscilloscope to the circuit at Va you will short the circuit there and eliminate the resistance of R5. Since the all of the resistors have the same resistance they should all use the same amount of voltage. This is proven in our measurements since Vb is very close to twice the value of Va in AC and DC mode on the DMM.

a.
Calculate R so given voltage values are
satisfied. Explain your work (video)
Since the quality of video decreases after we uploaded, so we put a photo here to show the details of calculation.
Video 1. calculation for R7
 |
| Figure 7. Calculation for R7 |
b.
Construct the circuit and measure the values
with the DMM and oscilloscope (video). Hint: 1kΩ cannot be probed directly by
the scope. But R6 and R7 are in series and it does not matter which one is
connected to the function generator.
Video 2. Measuring the values with the DMM and oscilloscope
 |
| Figure 8. Voltage for R6 |
 |
| Figure 9. Voltage for R7 |
We built the circuit and measured the voltages of R6 and R7 by
DMM and oscilloscope, and the results were close to our calculations before.
Similarly, the quality of video decreases after we uploaded, so we
put two photos to show the voltage values we got.
(correction:
at the last part of the video, what we mean is R7 not R4... )
10.
Operational amplifier basics: Construct the
following circuits using the pin diagram of the opamp. The half circle on top
of the pin diagram corresponds to the notch on the integrated circuit (IC).
Explanations of the pin numbers are below:
1: DO NOT USE
|
8: DO NOT USE
|
2: Negative input
|
7: +10V
|
3: Positive input
|
6: output
|
4: -10 V
|
5: DO NOT USE
|

a.
Inverting amplifier: Rin = 1kΩ, Rf
= 5kΩ (do not forget -10 V and +10
V). Apply 1 Vpp @ 1kHz. Observe input and output at the same time.
What happens if you slowly increase the input voltage up to 5 V? Explain your
findings. (Video)
For the
inverted amplifier we noticed when the input signal was at its lowest point,
the output signal was at its peak. When the input voltage is low the output
signal is a sine wave, as the input voltage was increased the output signal was
transformed into a square wave. We found
that the input signal voltage does not affect the output voltage, because the output already reach the maximum value during increasing V input. The voltage
that controls the output was the voltage going into the number 4 and 7 pin on
the LM741. Since the voltage for pin 4 is -10V, and the voltage for pin 7 is +10V, so it means the range of Vout will be -10V to 10V.
Video 3. Inverting amplifier
b. Non-inverting amplifier: R1 = 1kΩ, R2 = 5kΩ (do not forget -10 V and +10 V). Apply 1 Vpp @ 1kHz. Observe input and output at the same time. What happens if you slowly increase the input voltage up to 5 V? Explain your findings. (Video)
For the
non-inverted amplifier set up, the signal is not inverted so when the input
signal peaked so did the output. If we increased the voltage of the input
signal we did not see an increase in the output voltage. We found that the
input signal voltage does not affect the output voltage, because the output already reach the maximum value during increasing V input. The voltage that controls
the output was the voltage going into the number 4 and 7 pin on the LM741. Similarly, the voltage for pin 4 is -10V, and the voltage for pin 7 is +10V, so it means the range of Vout will be -10V to 10V.
Video 4. Non-inverting amplifier
Nice job Yao and Mr. Mccomb! The scope pictures are clear and easy to see.
ReplyDeleteGood explanation for question 4! I also like that you posted an image of the calculation for R7 along with the video.
ReplyDeleteThanks Collin and Tyler!
Delete#3 and 4 are not quite correct.
ReplyDelete7b: Good idea. You could also replace R4 and R5 so you can now measure Va as the voltage across R4.